Most people will never know their browser hides a great set of tools, mostly used by web developers, but which can be useful for anyone trying to figure out why their browser seems to be acting up.
Finding out why a page is slow, when an addon is throwing errors, what’s being requested or sent out - all possible in the dev console. I had to use them just the other day to figure out why a single post on this blog wasn’t displaying the summary on the main page - an unexpected character was messing up some custom JavaScript code.
Without further ado…
Chrome#
Author: Google
Toolset: Chrome DevTools
- To view elements of the page (DOM/CSS), either right-click and select “Inspect” or press
Command+Option+C(Mac) orControl+Shift+C(Windows, Linux, Chrome OS). - To view the console (logged messages, run JavaScript), press
Command+Option+J(Mac) orControl+Shift+J(Windows, Linux, Chrome OS).
Firefox#
Author: Mozilla
Toolset: Web Console
- Select “Web Console” from the Web Developer submenu in the Firefox menu (or Tools menu if you display the menu bar or are on Mac).
- Or press
Ctrl+Shift+KorCtrl+Shift+CorCtrl+Shift+I(Windows). - Or press
Command+Option+K(Mac).
Opera#
Author: Opera Software
Toolset: Developer Tools Console
The shortcuts seem to be the same as Chrome, at least by default.
- To view elements of the page (DOM/CSS), either right-click and select “Inspect” or press
Command+Option+C(Mac) orControl+Shift+C(Windows, Linux, Chrome OS). - To view the console (logged messages, run JavaScript), press
Command+Option+J(Mac) orControl+Shift+J(Windows, Linux, Chrome OS).
You can also change the shortcuts if you’d like:

Brave#
If you’re not using Brave yet, do. This is my preferred browser now that they have all of the annoying kinks worked out… it’s more secure by default and they have this novel idea for rewarding good content.
Author: Brave Software Inc
Toolset: Developer Tools
The shortcuts seem to be the same as Chrome and Opera.
- To view elements of the page (DOM/CSS), either right-click and select “Inspect” or press
Command+Option+C(Mac) orControl+Shift+C(Windows, Linux, Chrome OS). - To view the console (logged messages, run JavaScript), press
Command+Option+J(Mac) orControl+Shift+J(Windows, Linux, Chrome OS).
Internet Explorer#
Author: Microsoft
Toolset: Developer Tools
- Press
F12. - Or right-click and choose “View source” or “Inspect element”.
Edge#
Author: Microsoft
Toolset: Microsoft Edge DevTools
- Press
F12orControl+Shift+JorControl+Shift+I. - Or right-click and choose “View source” or “Inspect element” (possibly only after opening the DevTools at least once).
Safari#
Author: Apple
Toolset: Web Inspector
That link is a pretty basic (nearly useless) overview - there’s more detail in the Safari Developer Help docs. I don’t have a Mac or Safari, so the best I could do to test this was download Safari 5 for Windows from 2012.
- Enable the Develop menu in Advanced preferences:
Safari > Preferences > Advanced > Show Develop menu, then chooseDevelop > Show Error Console - Select Show Web Inspector Option-Command-I in the Develop Menu. Or control-click anywhere in the Safari tab and choose “Inspect Element” from the menu.
- You can also add a Web Inspector button to your toolbar by customizing your Safari Window.
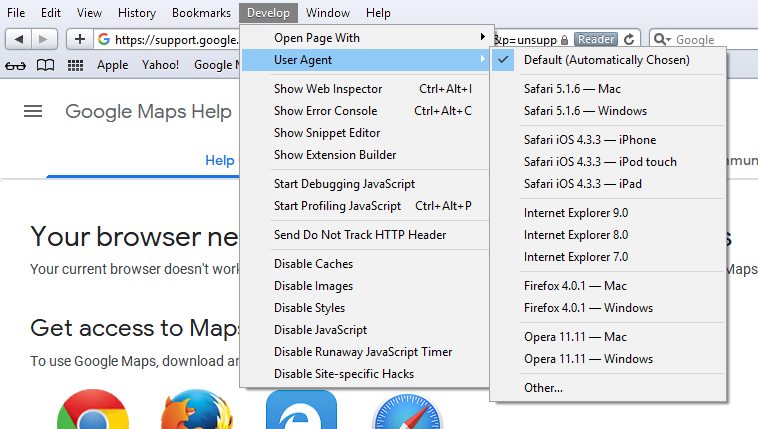
- If you’re using the last available Windows version from 2012:
Edit > Preferences > Advanced > Show Develop menu in menu bar - After showing the new menu, you can view page elements with
Control+Alt+Ior the console withControl+Alt+C. Beware, it’s a pretty busted experience. 🙄