
OpenWeatherMap provides free access to current weather conditions, 5-day forecast, uv index, alerts, etc. Let’s check out the OpenWeatherMap API.
First though, two things to consider:
- If you’re unfamiliar with APIs, you might want to read this first to familiarize yourself.
- Install Postman, which allows you to access API endpoints without having to write an app, as well as save the calls you make and sync them online.
Authorization#
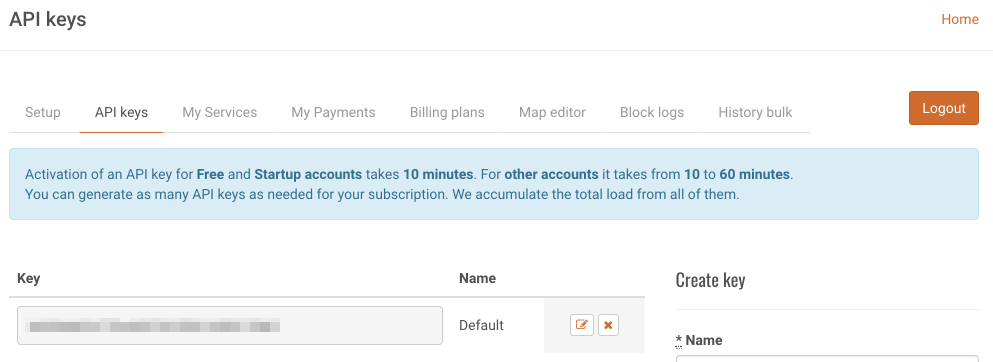
Sign up to request an API key. You should end up in a user settings area where you can select the “API keys” tab. It showed a message about taking 10 minutes to generate keys but then it already had a key immediately generated and ready to go, so… I don’t know.
Get Current Weather#
There are a number of ways to request current weather data for your area, but the two most accurate ones seem to be using zip code, and using latitude/longitude:
GET http://api.openweathermap.org/data/2.5/weather?lat=41.4984174&lon=-81.69372869999999&APPID=<your-app-key>

GET http://api.openweathermap.org/data/2.5/weather?zip=44113,US&APPID=<your-app-key>
It returns an abundance of data for the location - you can read about the result values here. Here’s the result for Cleveland OH, where it’s snowing lightly. There’s also a block with other current conditions, such as:
- Tempature, in Kelvin (261.02 K is about 10 Fahrenheit)
- Barometric Pressure, in mm (1038 mm is about 40 inches)
- Humidity, percentage (it’s currently snowing so the humidity is high)
- Min and Max temps, in Kelvin (deviation for large geographical areas)
- Visibility, in meters (about 9 miles)
- Wind speed and direction, in m/sec (about 6 mph, due South)
- Cloud cover (currently 90%)
- Timestamp of request (which you can convert to normal time here)
- Timestamps of sunset and sunrise (currently 7:52:43 AM and 5:05:01 PM, respectively)
{
    "coord": {
        "lon": -81.69,
        "lat": 41.5
    },
    "weather": [
        {
            "id": 600,
            "main": "Snow",
            "description": "light snow",
            "icon": "13d"
        }
    ],
    "base": "stations",
    "main": {
        "temp": 261.02,
        "pressure": 1038,
        "humidity": 66,
        "temp_min": 259.15,
        "temp_max": 262.15
    },
    "visibility": 14484,
    "wind": {
        "speed": 2.6,
        "deg": 180
    },
    "clouds": {
        "all": 90
    },
    "dt": 1514472900,
    "sys": {
        "type": 1,
        "id": 2166,
        "message": 0.0045,
        "country": "US",
        "sunrise": 1514465563,
        "sunset": 1514498701
    },
    "id": 5150529,
    "name": "Cleveland",
    "cod": 200
}
Finding Latitude/Longitude#
If you need to lookup the coordinates of a location, check out the Google Maps API - they have an endpoint for just that purpose. You can parse out the geometry/location values and use those in the weather request.
GET https://maps.googleapis.com/maps/api/geocode/json?address=50 Public Square Cleveland, Ohio&key=<your-key>{
"results": [
{
"formatted_address": "50 Public Square, Cleveland, OH 44113, USA",
"geometry": {
"location": {
"lat": 41.4984174,
"lng": -81.69372869999999
},
...
...Get 5-Day Forecast#
The process for getting the 5-day forecast is pretty much the same as current weather, except you get a lot more data - every 3 hours worth, in fact.
GET api.openweathermap.org/data/2.5/forecast?lat=41.4984174&lon=-81.69372869999999&APPID=<your-app-key>Here’s a small portion of the results - there’s a dt_txt field that clearly shows that each “block” of JSON data is for a 3-hour interval.
{
    "cod": "200",
    "message": 0.0044,
    "cnt": 40,
    "list": [
        {
            "dt": 1514570400,
            "main": {
                "temp": 264.96,
                "temp_min": 263.056,
                "temp_max": 264.96,
                "pressure": 1006.4,
                "sea_level": 1041.63,
                "grnd_level": 1006.4,
                "humidity": 100,
                "temp_kf": 1.9
            },
            ...
            "dt_txt": "2017-12-29 18:00:00"
        },
        {
            "dt": 1514581200,
            "main": {
                "temp": 264.29,
                "temp_min": 263.016,
                "temp_max": 264.29,
                "pressure": 1005.31,
                "sea_level": 1040.53,
                "grnd_level": 1005.31,
                "humidity": 100,
                "temp_kf": 1.27
            },
            ...
            "dt_txt": "2017-12-29 21:00:00"
        },
        {
            "dt": 1514592000,
            "main": {
                "temp": 261.97,
                "temp_min": 261.333,
                "temp_max": 261.97,
                "pressure": 1005.29,
                "sea_level": 1040.7,
                "grnd_level": 1005.29,
                "humidity": 100,
                "temp_kf": 0.63
            },
            ...
            "dt_txt": "2017-12-30 00:00:00"
        },
        ...
        ...
Historical Data#
Update: Someone asked me about historical data, so I figured I’d post what I found here. If you’d like to get historical data, such as the weather in a certain location for all of 2017, the endpoint changes from api to history:
GET history.openweathermap.org/data/2.5/find?q=Cleveland&type=accurate&units=metric&mode=xml&start=1483228800&end=1485820800&APPID=<your-app-key>Unfortunately (but understandably), this data is not free. If you try to use the free token, it’ll return a 401 error with the message “Invalid API key.” You can find out more about pricing on their site.
Thoughts#
It’s unclear what the usage limits are. The page where you get an app key warns against sending requests “more than 1 time per 10 minutes from one device/one API key”, which seems like an extreme limitation. Yet the page that compares price and packages says “no more than 60 calls per minute” for a free account, and thousands or even hundreds of thousands per minute for paid accounts; that seems more reasonable.
There are several ways to get weather data. It’s odd that the method they encourage is to use a “city id” - a value you get from a JSON file they provide, but the file is not organized in any particular order and has well over a million lines in it. They also provide a way that uses city and country, but that’s inaccurate - I live by Cleveland, OH but there’s also a Cleveland, GA. Guess there could be a use-case, and it’s there if you need it, I just don’t think I’d use it.
The other APIs available for use with a free account are Weather Maps, UV Index, Air Pollution, and Weather Alerts. The last three are still in beta, whatever that means - not sure if that means they’re not quite reliable yet? Still would be interesting to try. I could see looking up alerts and then having a Raspberry Pi or similar light an LED or sound a siren for certain conditions.